Survival Guide for Debugging Serverless Applications With Lumigo
Introduction
In the world of serverless applications, developers enjoy the freedom of crafting and deploying their code without the burden of managing and provisioning servers. This is made possible by leveraging third-party cloud providers such as Amazon Web Services (AWS), Google Cloud Platform (GCP), and Microsoft Azure, which handle the entire underlying infrastructure of their dedicated servers.
In contrast, traditional application architectures impose upon developers the duty of maintaining their own servers and assuming full responsibility for the entire application stack. This involves maintaining the actual physical hardware, cooling systems, handling server failures, and the incredibly complicated scaling operation, among other tons of tedious, time and resource-consuming tasks. Recognizing these challenges, an increasing number of today's developers are shifting toward the more appealing realm of serverless applications.
Understanding The Challenges of Debugging Serverless Applications
Despite the numerous benefits serverless applications bring to developers, including unparalleled ease of use and peace of mind, they aren't without their own set of challenges. One of the most significant hurdles developers encounter is the limited transparency into the underlying infrastructure. This constraint makes it difficult to monitor server and application performance effectively, which consequently creates a blind spot in application performance monitoring, which causes its own set of challenges.
Having acknowledged this, in the upcoming sections of this article, we will delve deeper into the complexities of debugging serverless applications. Additionally, we'll introduce a contemporary solution known as Lumigo that tackles these challenges head-on, paving the way for smoother serverless application management and development. Despite the numerous challenges associated with debugging serverless applications, two issues are particularly prevalent within this realm.
Limited Control over the Infrastructure
When using third-party cloud providers like AWS, developers have limited visibility and control over the underlying infrastructure of serverless applications. The cloud provider abstracts away the servers and infrastructure details, making it challenging for developers to have deep insights or make direct modifications to the underlying infrastructure components.
Although developers still have control over their application logic, they rely on the cloud provider's infrastructure management and configuration. This limited control can pose challenges when debugging and troubleshooting issues related to specific infrastructure configurations or performance bottlenecks.
Lack of Server Diagnosis Due to Bad Monitoring and Observability
It is crucial for developers to monitor the number of users accessing their server at any given moment, tally system failures, assess current CPU utilization, and evaluate bandwidth usage. It's essential to have precise, real-time insights into these system metrics to maintain optimal performance.
Monitoring refers to the systematic process of gathering and analyzing these system metrics. This practice aids in comprehending the system’s overall performance and identifying potential or existing issues.
To facilitate effective monitoring, servers should maintain specific logs that record every action performed by a user. This is not done to track an individual user's behavior but rather to monitor the system's holistic performance. It allows us to identify trends, troubleshoot issues, and understand how users interact with the system.
Exploring the Benefits of Lumigo for Serverless Debugging
Lumigo is a dedicated troubleshooting platform that allows developers to easily troubleshoot, monitor and debug servers and containerized environments with a range of complexities. In the ensuing discussion, we will state a few ways in which developers can employ such a tool in their day-to-day tasks to ease their workload and enhance their productivity.
Advanced Server Tracing
By leveraging specially-designed monitoring and troubleshooting platforms like Lumigo, developers can efficiently track transactions across a multitude of application microservices. The platform offers an intuitive, hands-on visualization interface that assists developers in identifying and resolving problematic patterns within their systems.
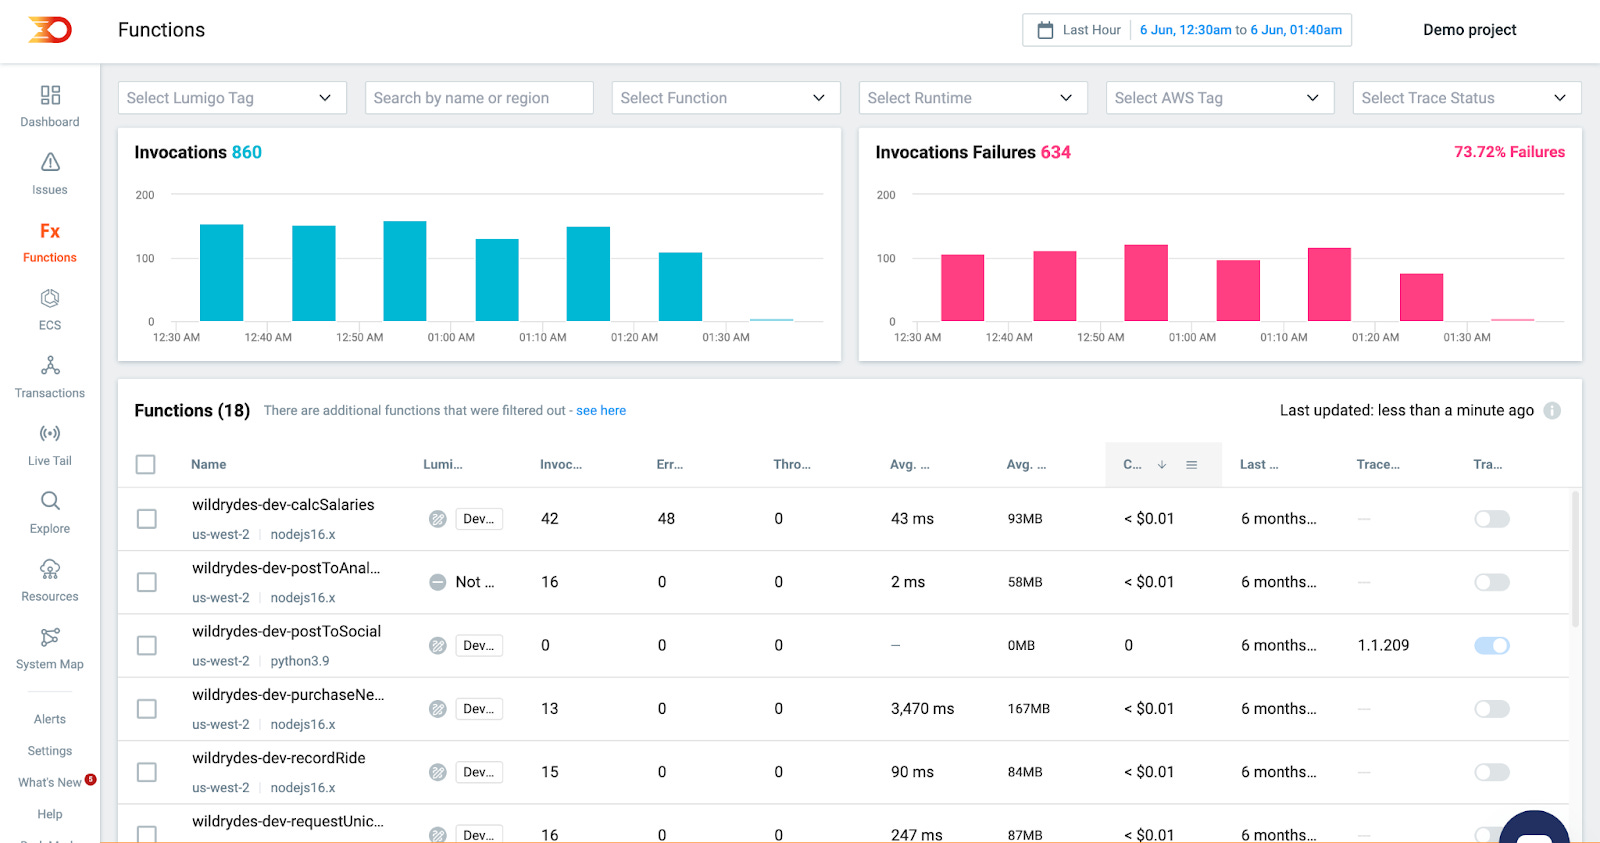
The image above shows the visualization interface where developers can monitor specific functions and track details like the number of times each function is invoked, the cost of such a transaction, its duration, memory usage, and the frequency of failures, among other useful data. Thus, Lumigo enables developers to identify the functions generating the most errors. This feature facilitates rapid problem resolution, decreases overall system costs by identifying exceptionally costly functions, and improves system performance by identifying slower server calls that are reducing the system’s overall bottleneck capacity.
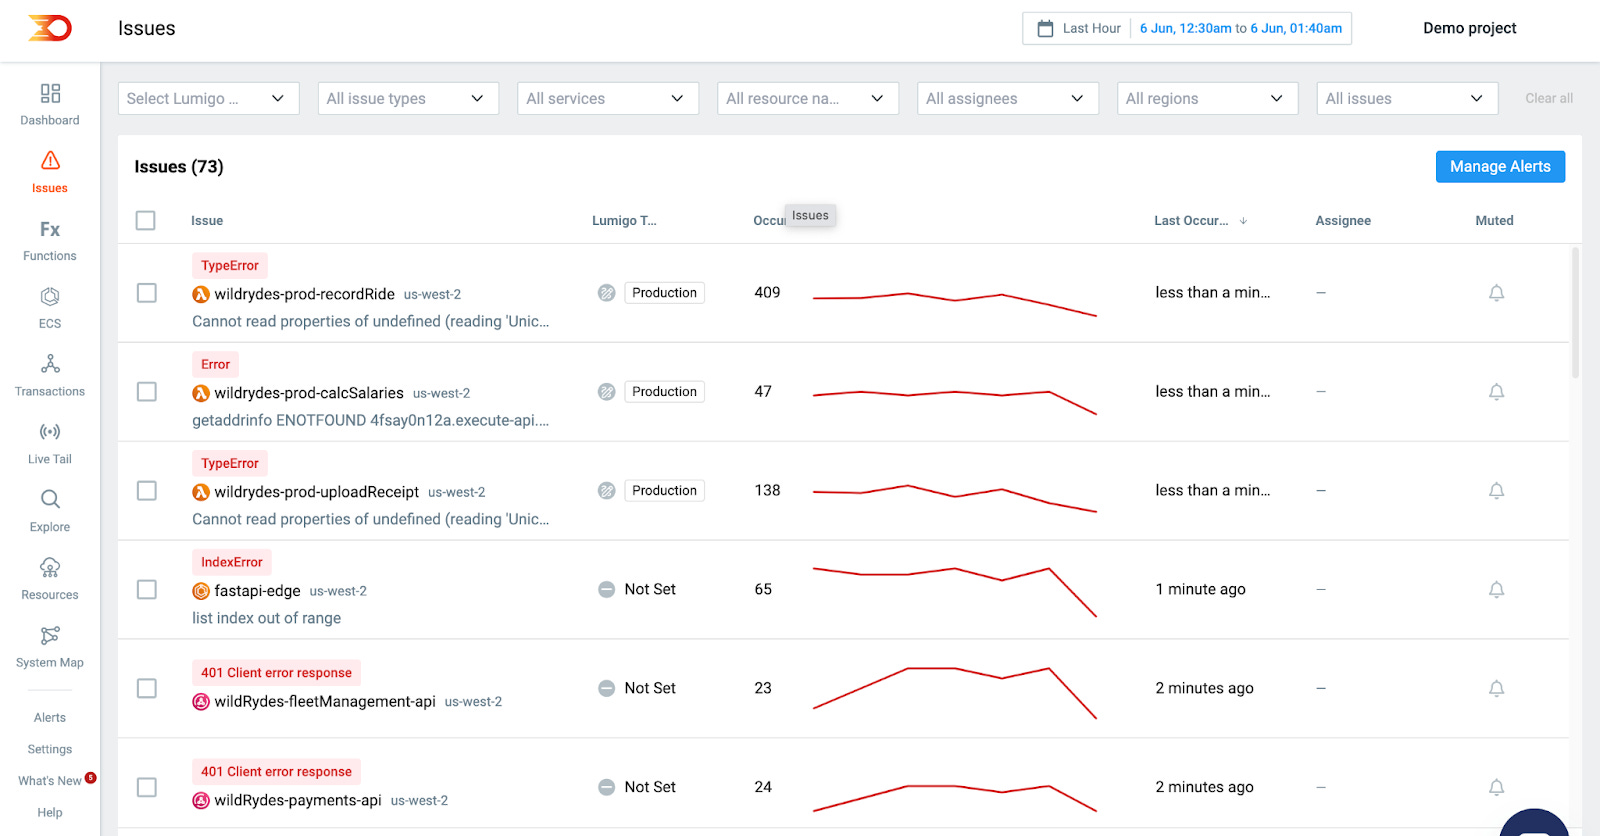
Simplified Error Detection
Efficient error detection is the cornerstone of software development and maintenance. It allows developers to identify and correct system errors promptly. This efficiency not only streamlines the troubleshooting process but also significantly enhances the system's reliability. By minimizing the time between the occurrence of an error and its resolution, businesses can ensure seamless user experiences, ultimately bolstering user satisfaction and trust in their services.
Alerting and Notification Features
Specialized alerts can be put in place to flag things like high error rates, server costs, and more. After all, two of the most common and highly used alert types are Event Alert (triggered when an event occurs that matches the exact alert condition specified by the user) and Metric Alert (triggered when a metric exceeds a specific threshold). For example, this can be the case if the server exceeds the specified network bandwidth provided.
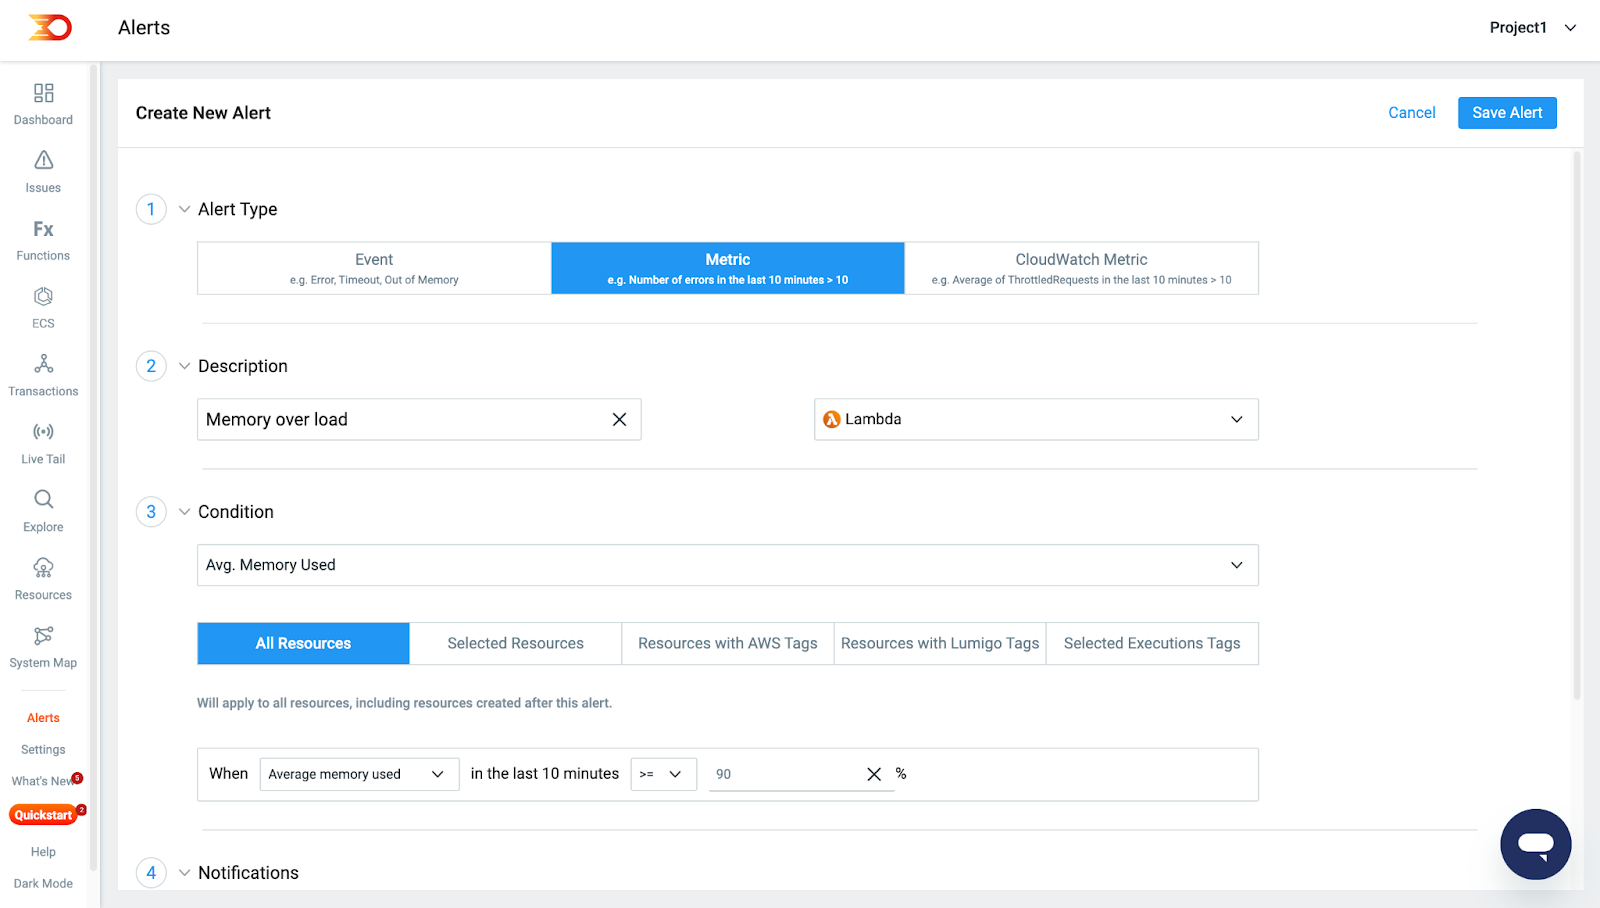
The Lumigo platform makes the creation process of such alerts incredibly easy. The image above details the process of creating an alert using Lumigo. In this specific example, we're establishing a Metric Event Alert. This alert is configured to notify us via email when memory usage surpasses the 90 percent threshold, informing us in case our system’s memory is overloaded.
Conclusion
The power of efficient debugging for serverless applications cannot be underestimated. Given the complexity of today's distributed systems, developers require more than just an efficient monitoring method—they need dependable and user-friendly tools to navigate this intricate process. Tools such as Lumigo stand out in this regard, providing users with the means to monitor the health of their systems closely.
With streamlined debugging and monitoring processes, businesses can deliver superior services to their customers. This ensures reliability and infuses positivity into their offerings, strengthening customer trust and ultimately boosting overall business profitability. It's a digital age where effectiveness, efficiency, and ease of operations are critical to success, and tools like Lumigo help unlock that potential.