Leveraging Synthetic Monitoring Tools for Proactive Monitoring Techniques
Synthetic monitoring is adding and simulating real user scenarios in your pipelines. Often, multiple developers collaborate on a project, and code is constantly being pushed into the codebase. Now, these features can be interdependent, and with the volume of code being pushed, it is pretty hard for code reviewers to ensure that these changes don't introduce bugs or slowness in other parts of the application.
This is where synthetic monitoring comes in. With synthetic monitoring, developers can add tests that simulate real user behaviors like logging in, adding a new product to a cart, making a payment, and making a purchase. They can add test suites for all features and end-user flows, covering all the critical aspects of the application. The code will get merged only if these pipelines run successfully, which helps prevent faulty code from getting merged and also production incidents.
Businesses can also get metrics on API response times using synthetic monitoring, which helps understand the kind of load your application is currently able to handle and if it requires upscaling. That said, there are several synthetic monitoring tools in the market. We will discuss eight of the top-used tools for synthetic monitoring and understand the advantages of each of them.
Checkly
Checkly is a synthetic monitoring tool that helps you proactively test and monitor your web applications. It simulates real end-user behavior and provides actionable insights to ensure a smooth user experience. Developers and stakeholders can view useful metrics on API response times and identify bottlenecks to optimize application performance. Checkly can send alerts on several channels, including Slack and SMS. It also provides detailed logs to enable on-call engineers to debug issues rapidly. Checkly provides Microsoft Playwright integration, which enables automated testing of the UI. It is a great solution for teams to get started with synthetic monitoring on applications. It integrates seamlessly with popular CI/CD tools and alerting platforms. Checkly is a great choice for organizations getting started owing to its free tier and flexible code-based monitoring, allowing for custom texts in your setup.
Pingdom
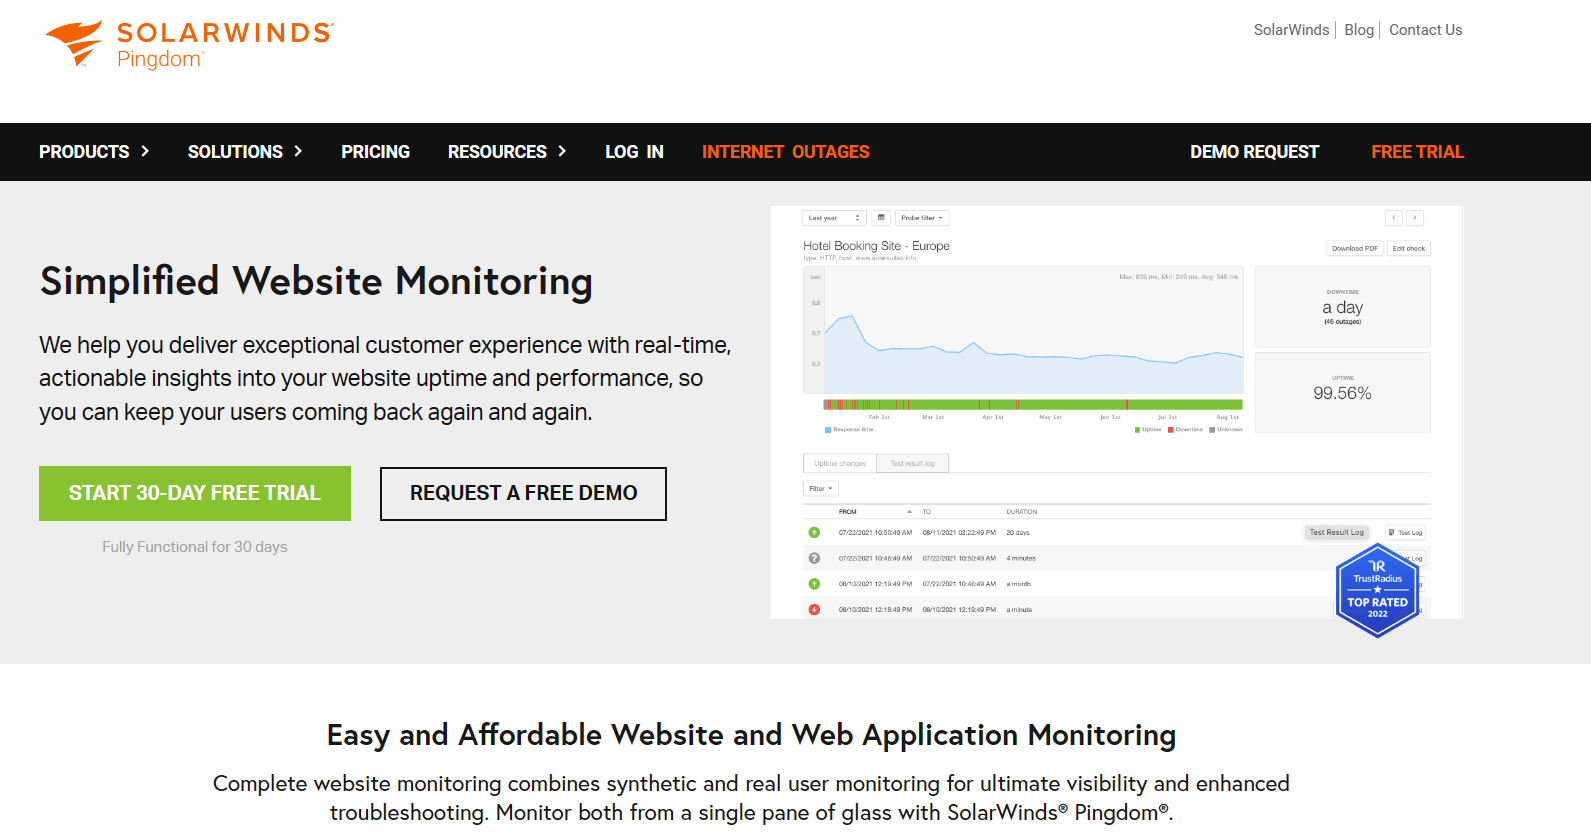
Pingdom is a synthetic monitoring tool popular for its user-friendly interface. It can provide powerful performance insights. You can monitor your website's speed and ensure all the functionality is working as expected, ensuring a smooth user experience. It is a great load testing tool, measuring the loading times of webpages and individual components, which helps in identifying issues and optimization. The interface is easy to use for non-technical users. You can get started with basic monitoring for free using the free tier. However, if you want to write advanced testing scripts, you will need external tools, as Pingdom only allows basic customs checks. Prices can be on the higher side for small businesses.
Sematext
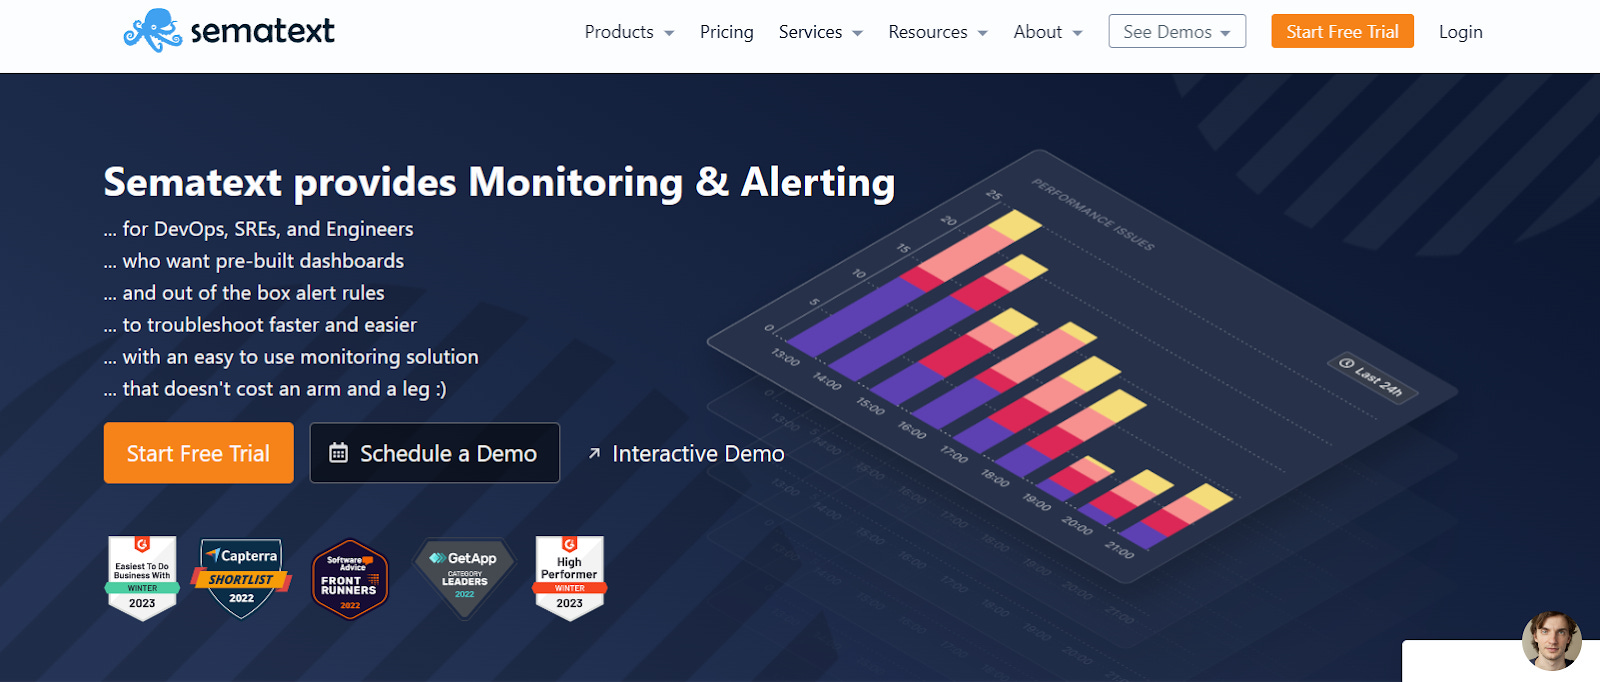
Sematext is a synthetic mentoring tool known for being cost-effective and efficient. It checks if your application is up and running from different parts of the world, sending alerts in case of downtime. Developers can measure load times and API response times, which can help you find bottlenecks and fix them. Sematext lets you write scripts to simulate real end-user behavior to test complex application flows. Developers can create customized alerts based on your requirements and trigger cases for more focused errors. Sematext integrates seamlessly with several open source platforms, making it more flexible. However, the global coverage for testing is less than that of other synthetic monitoring tools. Sematext would be a good, cost-effective choice for businesses that are just starting with synthetic monitoring.
Dynatrace
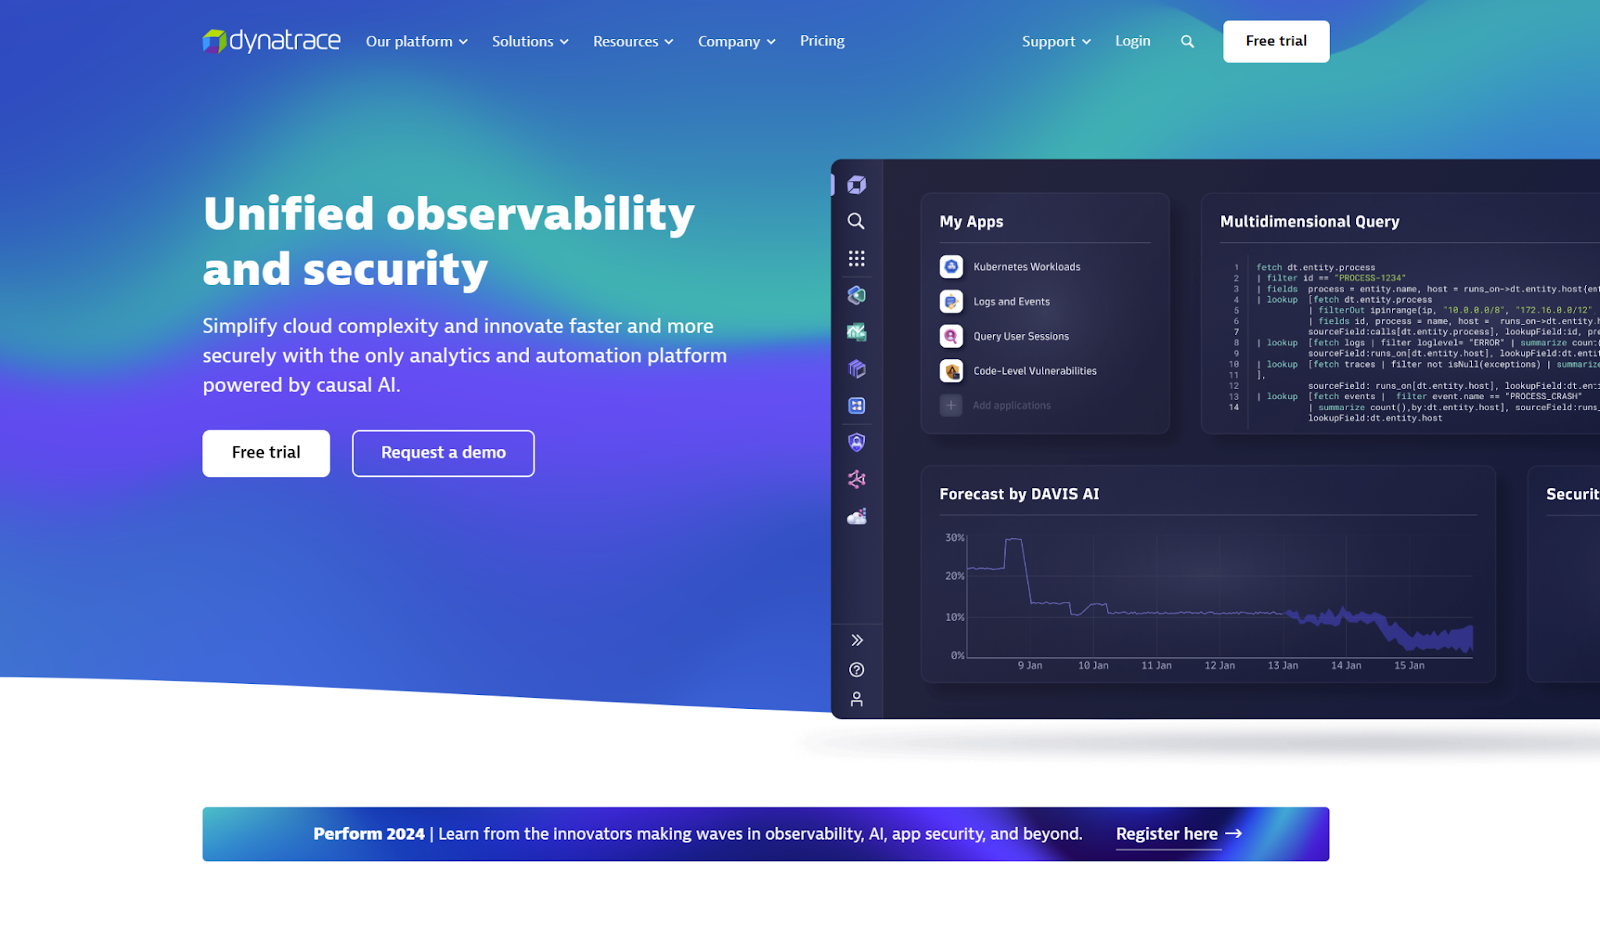
Dynatrace is a powerful synthetic monitoring tool. It allows you to create tests simulating complex user journeys with multiple steps and interactions. You can monitor the uptimes of selected web pages and analyze API usage metrics for certain endpoints. Dynatrace lets you create custom alerts based on specific triggers and threshold values to receive meaningful notifications and reduce false alerts. You can use detailed logs and metrics provided by Dynatrace to perform a detailed root-cause analysis of bugs. It also provides waterfall chats to visualize the loading of web pages and identify bottlenecks. Davis, Dynatrace’s AI engine, provides actionable recommendations and suggestions for troubleshooting based on the application performance data.
New Relic
New Relic is a popular synthetic monitoring tool providing several powerful features. Developers can simulate complex user journeys for their applications. New Relic is beginner-friendly, allowing easy user journey simulation with drag-and-drop scripting. This makes it easier for both technical and non-technical users to use. It has shared dashboards and alerting for fast incident resolution. Developers can create complex user workflows with JavaScript with the help of New Relic’s advanced scripting capabilities. New Relic also allows you to integrate with other tools for a unified monitoring experience. It scales seamlessly, accommodating different monitoring scenarios. However, New Relic might be on the pricier side as compared to its competitors for basic monitoring.
Catchpoint
Catchpoint is a synthetic mentoring tool known for its unmatched global reach, with coverage of over 75+ countries. Correlator, Catchpoint’s AI brain, analyzes data, pinpointing root causes and suggesting solutions. You can track performance and spot trends, which enable you to make effective scaling decisions to prevent issues. Catchpoint allows you to create complex tests for user stories, which can run at scheduled intervals to identify potential issues. Along with web applications, you can also test mobile apps and IoT devices with Catchpoint.
Uptrends
Uptrends is a user-friendly solution focusing on real-browser checks. It simulates user journeys from global regions across browsers, delivering actionable insights. Uptrends has visual scripting, which makes it easier for non-technical users to create complex checks using drag-and-drop mechanisms. It provides real-time metrics, charts, and reports based on your application’s performance across devices and regions. You can customize alerts and send them to several channels, including SMS and Slack.
Datadog
Datadog is a synthetic monitoring solution with advanced capabilities and scalability. It provides global coverage for testing along with the ability to create complex scripts simulating user logins and journeys. Datatog comes with intelligent anomaly detection and alerting mechanisms as opposed to traditional threshold-based alerting systems, reducing false positives. It can integrate seamlessly with other DevOps workflows and tools, streamlining the testing process and making it easier for development teams to detect and resolve bugs faster.
Conclusion
As teams collaborate and application codebases get more and more complex, it gets increasingly hard to ensure that new changes don’t break existing functionalities, especially when multiple developers are working on the same code base. This can lead to production incidents and reduced application performance. It is also important to ensure that the application behaves as expected uniformly across different browsers, devices, and regions.
Hence, teams need to have a robust end-to-end testing mechanism in place so that their issues are detected and fixed before the code gets pushed to the code base. Integrating synthetic monitoring tools with CI/CD pipelines helps teams streamline development, resolve incidents before they occur, and also gain actionable information from reports to improve scaling strategies.
Great roundup! If someone’s just getting started, which tool would you say has the easiest learning curve?
This was deeply insightful. Helped me make sense of where I am as an engineer, and reemphasized the important of source control and test-driven design.