
Kubernetes Monitoring Made Easy: Tools and Best Practices
Kubernetes Monitoring Made Easy: Tools and Best Practices

Introduction
Kubernetes, the versatile container orchestration platform, has revolutionized the world of containerization and microservices. While Kubernetes offers powerful features for managing applications, it's essential to monitor your clusters to ensure optimal performance, reliability, and security. Kubernetes monitoring tools play a pivotal role in helping you gain insights into the health and performance of your clusters. In this listicle, we'll explore eight essential Kubernetes monitoring tools, each with unique features to make your monitoring tasks easier and more efficient.
groundcover
groundcover is an all-in-one Kubernetes (cloud native application) monitoring solution that excels in real-time monitoring, alerting, and log aggregation. With its user-friendly interface and customizable alerting system, groundcover simplifies the process of keeping your Kubernetes clusters healthy and performant. It provides comprehensive insights into resource usage, performance bottlenecks, and potential issues within your clusters. groundcover's robust log aggregation capabilities make troubleshooting a breeze, allowing you to pinpoint and resolve issues quickly.
In addition to monitoring clusters, groundcover also offers powerful visualization tools, enabling you to create customized dashboards tailored to your specific needs. These dashboards help you gain real-time insights into the state of your applications and infrastructure, making it easier to optimize resource allocation and ensure the reliability of your services.
Prometheus

Prometheus is an open-source monitoring and alerting toolkit that is widely adopted in the Kubernetes community. It stands out for its ability to collect, query, and alert on time-series data, which is crucial for understanding the performance and health of your Kubernetes clusters. Prometheus is designed to be highly adaptable, making it easy to integrate with various systems and applications.
One of its strengths lies in its alerting capabilities. You can set up custom alerts based on specific conditions or thresholds, ensuring you are notified of potential issues as soon as they arise. With Prometheus, you can also create dynamic and informative dashboards, empowering you to visualize and analyze the data collected from your clusters.
Grafana

Grafana is a versatile open-source platform for monitoring and observability that complements Prometheus and other data sources seamlessly. It offers a range of features that simplify Kubernetes monitoring, including a rich set of visualization options, alerting, and interactive dashboards. Grafana is known for its user-friendly interface, making it accessible to both beginners and seasoned professionals.
With Grafana, you can create customized dashboards with easy-to-understand visualizations that provide insights into your Kubernetes clusters' performance, resource usage, and overall health. It supports various data sources, ensuring you can consolidate data from multiple systems into a single dashboard.
Datadog
Datadog is a cloud-based monitoring and analytics platform that offers Kubernetes-specific integrations, making it a top choice for those working with containerized applications. Datadog provides end-to-end visibility into your Kubernetes clusters, including infrastructure monitoring, APM, and distributed tracing.
One of Datadog's standout features is its machine learning capabilities, which can help you identify patterns and anomalies within your Kubernetes environment, allowing for proactive issue resolution. It also offers extensive integrations, allowing you to monitor various other services, applications, and databases in conjunction with your Kubernetes clusters.
New Relic

New Relic is a complete observability platform that offers Kubernetes monitoring as part of its broader suite of tools. New Relic's real-time data, distributed tracing, and AI-driven insights make it a powerful choice for managing Kubernetes deployments.
With New Relic, you can gain deep insights into the performance of your applications and infrastructure, enabling you to identify and resolve issues quickly. Its AIOps features assist in automating the detection and remediation of anomalies, ensuring the stability and reliability of your Kubernetes clusters.
Sysdig
Sysdig is a container intelligence platform built specifically for Kubernetes. It excels in providing deep visibility into containers, infrastructure, and security aspects. Sysdig's Kubernetes integration ensures you can monitor and secure your clusters effectively.
One of Sysdig's strengths is its ability to capture system-level data, which is crucial for understanding container performance and security. It offers powerful troubleshooting features, including the ability to trace system calls, making it a valuable tool for diagnosing issues within your Kubernetes clusters.
Zabbix
Zabbix is an open-source monitoring platform that offers a wide array of monitoring capabilities for Kubernetes environments. With Zabbix, you can monitor cluster health, resource usage, and individual containers. It stands out for its flexibility, allowing you to create custom checks and alerting rules to suit your specific monitoring needs.
Zabbix's powerful yet straightforward web interface makes it accessible to users of all levels, while its extensibility through plugins and templates ensures you can adapt it to your evolving Kubernetes infrastructure.
Kibana
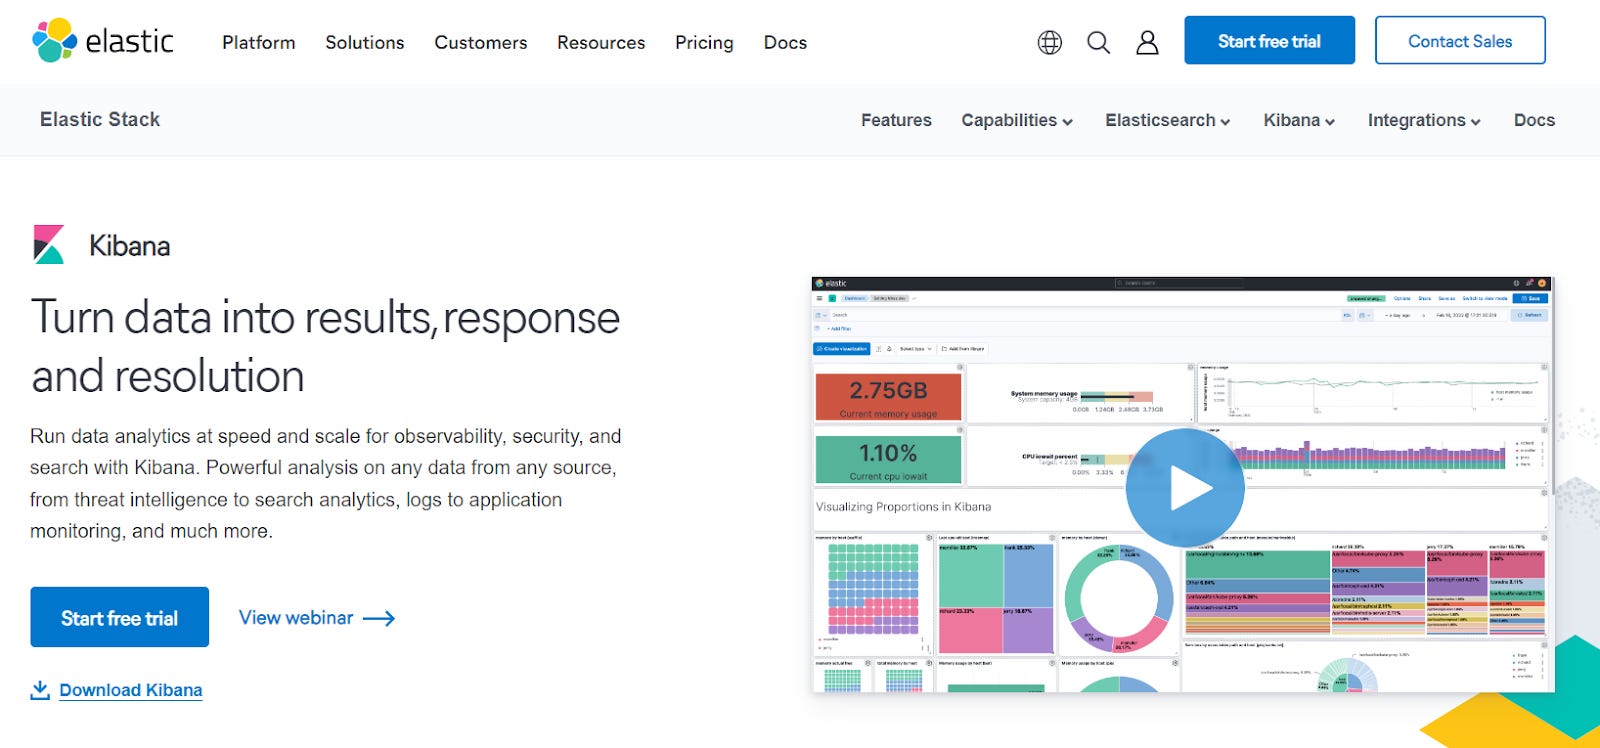
Kibana, part of the Elastic Stack, is known for its strong data visualization capabilities and is often used for log analysis and monitoring. It can be seamlessly integrated with Elasticsearch and Beats to provide a comprehensive Kubernetes monitoring solution.
Kibana excels in creating interactive and insightful dashboards for log and performance data. It allows you to aggregate and analyze logs from various Kubernetes clusters and applications, providing valuable insights into system and application health.
Each of these Kubernetes monitoring tools brings a unique set of features and capabilities to the table, making it possible to tailor your monitoring strategy to your specific requirements. By choosing the right tools and leveraging their capabilities, you can ensure the health, performance, and security of your Kubernetes clusters while simplifying the monitoring process.
Conclusion
Kubernetes monitoring is a critical aspect of managing containerized applications effectively. The right tools can make this task easier and more efficient. By using the mentioned tools, you can gain real-time insights, troubleshoot issues, and ensure the performance and security of your Kubernetes clusters. Whether you are an operator, developer, or DevOps engineer, these monitoring tools will help you keep your Kubernetes clusters healthy and performant.
With the right set of tools in your arsenal, Kubernetes monitoring can become a breeze, allowing you to focus on what truly matters – delivering reliable and efficient containerized applications. Remember, the choice of monitoring tools should align with your specific use case, and you can explore each tool's documentation for more in-depth information. Kubernetes monitoring is within your grasp with the help of these indispensable tools. Happy monitoring!